
The latest installment in an ongoing series of excerpts from The Fundraising Field Guide, by TrueSense Marketing.
You wouldn’t set out hiking across the vast frontier in a pair of hiking boots you never tried on before, would you? Of course not. You’d make sure those boots were the perfect fit before you set out on your trek.
The same goes for testing your offline or online direct-response fundraising appeals. You count on the results and the costs required to obtain those results. This holds true whether those are new and reactivated lapsed donors, advocacy actions from your constituents, or — and this is most important for many — the revenue active donors provide to fuel your mission.
You certainly would not abandon these important campaigns for new concepts without first “trying them on” for fit and feel.
Why Test?
In the largest sense, you should test to protect or, if possible, to improve the results from your current campaigns (which are known as “controls.”) But there are other, more detailed reasons to test:
- It’s important to continually innovate and find new ideas and new strategies.
- It is also important to test something you think you already know to see if donor behavior has changed over time.
What to Test?
Specifically, you can test pretty much anything. Typical areas of testing include:
- Creative (outer envelope, subject line, story, presence of inserts, presence of a freemium, type of freemium, imagery, margin notes)
- Audience (in cultivation and reactivation, this would be the select; in acquisition, the list and list segment)
- Offer
- Gift-ask logic
Often, nonprofits only think of testing creative, but large gains can be found in performance by testing other variables! So, a balance of types of tests is important across your fiscal year.
How To Test?
First of all, minimize risk. Remember, any new test holds the possibility of failure. So select your testing opportunities carefully. Develop a test statement and a hypothesis ahead of time to identify how the test results will be measured.
As an example, if you’re testing the inclusion of labels in a direct mail package, the testing statement would be: Will adding labels to the package increase the response rate? Or suppress the average gift? Or generate more revenue to offset the increased package cost?
Then, agree on the metrics you’ll use to evaluate the test, and compare to that of the control. Response rate? Average gift? Net revenue?
Let’s be clear: Testing shouldn’t ever just be done for the sake of testing. All tests need careful structure. Here’s how to do that:
- Establish your goals. These should be high-level, hopefully identified during your annual planning. They might look for increased donor retention, additional new-donor volume, increased frequency, improvement in average gift, or reduced costs. From there, map out the tests you want to perform throughout the year, and measure them against your goals. If it’s more important to increase average gift than to decrease costs, for instance, then focus your tests related to average gift to the beginning of the year.
- Build a testing matrix. It’s important to control your variables when testing. To do so, isolate only what you want to test. In direct mail, that means looking at every piece of the mailing and audience to ensure there is only one factor that is different between the control and the test. For instance, if you want to test new gift asks, everything else in the control and test should be the same. If you want to test a message on the outer envelope, there should be no other differences — story, offer, gift ask chart, or audience — from your control package. If variables aren’t controlled and isolated, you will not be able to say with confidence whether or not a test is a winner or a loser.
- Equalize your panel sizes. In other words, the quantity you test. The control panel and the test panel should have the same mail quantity.
- Wait with patience. For campaign-level tests, you should have all gifts recorded up until 90-120 days past the mail date before analyzing them. Reading your results before that means that the bulk of your responses will still be coming in, and the test results could change! For donor health tests, depending on the donor lifecycle or metric you are trying to influence, you may be able to read results at the six-month mark, or you may need to wait until up to 24 months to get a true read.
Coming Up With Conclusions
In determining whether a test is a winner or a loser, refer to your original testing statement and hypothesis, as well as the metrics you were planning to reference to determine the outcome. This will ensure you’re evaluating the results based on the reason(s) the test was performed.
Before assuming anything about how your test did, you must be comfortable that you can count on your performance data. Statistical validity is very important in interpreting test results:
- Analyzing response rate. The statistical validity of response-rate performance is dependent on the number of responses received, which is, of course, dependent on the number of pieces mailed. Ideally, you should have at least 1,000 responses in a two-panel test. This is often impossible, however, in smaller donor appeal mailings. Unfortunately, the lower the response rate and the lower the number of pieces mailed, the greater statistical variance you can expect in the response rate. Taking that variance into account could change your conclusions about the test.
Here’s an example. Say you mailed 20,000 pieces, split into equal panels of 10,000 for the control and 10,000 for the test. The control panel had a response rate of 0.80 percent. The test had a response rate of 0.93 percent. The test won, right?
Not so fast. At those quantities, the confidence level that they are different is less than 85 percent. (Statistical confidence is an easily determined number. See sidebar.) These results are statistically the same. Be careful not to declare a test the winner without checking the statistical significance. - Analyzing average gift. Average gift is far more difficult to evaluate, and should never be evaluated simply by looking at the average gift in a campaign report. Average-gift evaluation requires donor-level attributes such as individual transaction amounts. The reasons they’re needed are:
> To ensure large gifts aren’t skewing the results upward.
> To offer the ability to evaluate a gift histogram.
Take a look at the simple campaign-level results below. The tendency would be to declare Panel 3 a “loser” in terms of average gift, because it is $8 lower than Panel 2, and $3 lower than Panel 1.
| Panel | Response Rate | Average Gift |
| Panel 1 | 0.84% | $25 |
| Panel 2 | 0.61% | $30 |
| Panel 3 | 1.01% | $22 |
However, the response rate of Panel 3 is significantly higher, so it is important to look at a gift histogram (below) to see if Panel 3 truly is producing fewer high-dollar gifts — or if all gifts are increasing but, based on composition of where the increases are, it’s pulling the average down.
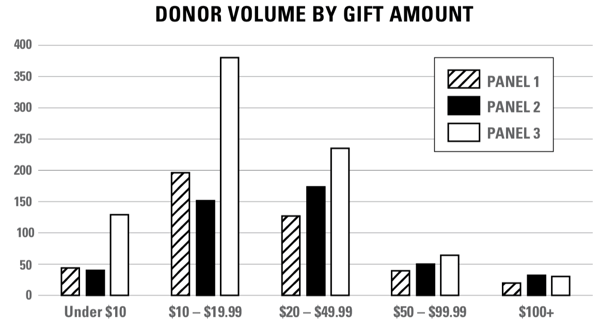
We found that the latter scenario was the case. Panel 3 resulted in as many (or more) donors at every level except the $100+ level, where Panel 3 had only two fewer gifts than Panel 2 — statistically insignificant.
- Keeping an eye on cost. Costs are also very important to include in your testing analysis. Sure, you can add a t-shirt to a mail package and increase the response rate 25 percent, but you’ll double your costs at the same time! At that rate, your net revenue would be lower for the t-shirt test. More often than not, costs and net revenue are important considerations for nonprofits. To fully understand the implication of costs in your testing, be sure you determine what your test would cost to produce in roll-out (control) quantities, should it win the test, and what that would mean for the net revenue you generate.
- Rolling it all up. A recommended metric that considers response rate, average gift, and cost is called Net per Response (NPR). NPR is calculated by: Gross Revenue minus Total Cost Divided by Number of Gifts.
In the end, the revenue you can expect from your testing programs will be influenced by average gift, response rate (the actual number of gifts generated), and cost. NPR helps you to determine if the response rate increased enough; if the costs increased too much; or if the average gift declined too much for the test to be a winner.
The NPR is a good equalizer of all of this: The test panel with the highest NPR can usually, and confidently, be declared the “winner.”
To minimize risk, it’s always good to get one more read on results by retesting. This is commonly done in acquisition with both list and package tests.
If your test results are significantly better, or if your test was originally performed just to ensure that simple tactics like an image or story change wouldn’t negatively impact results, you may feel comfortable “rolling out” your test as the control, and changing the original control to the test.
And remember ... even if the test is deemed a “loser,” it’s not bad news! Sometimes, learning what NOT to do is even more important than learning what TO do.
 This is an excerpt from our newly published Fundraising Field Guide.
Fundraisers have long sought to find and cultivate those with heroic human hearts who want to turn their compassion into action. Along the way, fundraisers have also learned lessons, honed skills, and crafted techniques that — in the end — are framed by basic human behaviors and motivations.
Get your copy of the complete compendium of tried-and-true tactics for conquering the fundraising frontier, written by TrueSense Marketing’s fundraising experts.